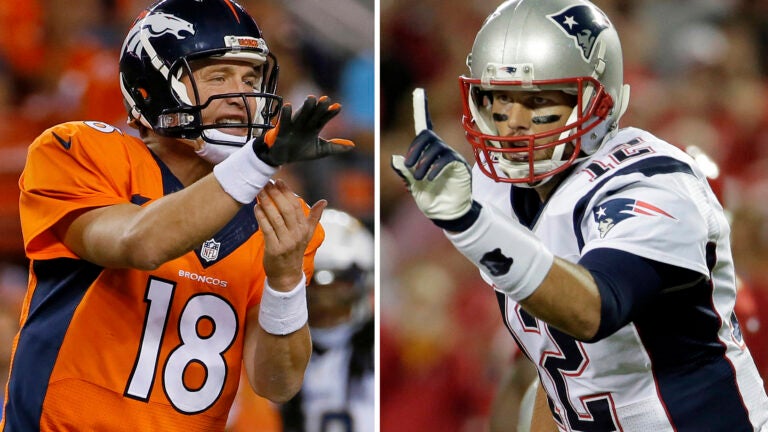
Tom Brady vs. Peyton Manning, by the numbers
It’s one of the most often-heard refrains in sports: “Player X is statistically better, but Player Y has more championships (or, Player Y is more clutch)’’
All-time greats (see: Dan Marino) are plagued by criticisms for never winning the big one, and players considered to be the best statistically are held back based on how many rings are on their fingers (see: Lebron James).
In the NFL, the perfect example of these two opposing schools of thought (clutchness vs. statistical superiority) can be found in the rivalry between Tom Brady and Peyton Manning. Brady proponents shore up their arguments with Lombardi trophies, Manning supporters with MVP awards.
But what story do the pure numbers tell? Although Manning’s pitiful regular season outing in 2015 brought down several of his key statistics, he still takes the career regular season statistical crown over Brady, although not by much.
[fragment number=0]
Manning leads in yards per game, touchdowns per game, completion percentage, passer rating (by a hair), and average yards per completion. Peyton also has 5 NFL MVP’s under his belt, as opposed to Brady’s 2.
Onto the postseason. Even if you throw Brady’s four rings out the window (don’t do that), Tom wins.
[fragment number=1]
Brady tosses up more touchdowns, lobs fewer interceptions, completes a higher percentage of his passes, and has a better overall quarterback rating.
And in their fifteen career matchups? Well, the numbers speak for themselves.
Manning has his ring, he doesn’t need to sell his soul to the devil. And Brady has his rings. The comparisons will not end after what could be the last Manning vs. Brady matchup this Sunday.
Bird had Johnson, and Brady has Manning. So it goes.
Every matchup between Tom Brady and Peyton Manning
[bdc-gallery id=”544114″]


To comment, please create a screen name in your profile
To comment, please verify your email address
Conversation
This discussion has ended. Please join elsewhere on Boston.com