10 stats that will determine the Red Sox’ success in 2017
COMMENTARY
Ten statistics worth tracking throughout the season because the Red Sox’ success could possibly depend upon them…
Craig Kimbrel’s walk rate
The closer’s ERA (3.40) and WHIP (1.09) for 2016 were his highest over a full season, though the biggest concern was a walk rate that spiked to 5.1 per nine innings. Over the five prior seasons it had never been north of 3.8, and had averaged out to 3.1. He averaged 14.1 strikeouts per nine innings, actually marking an increase there, and if there’s any doubt that his stuff is still filthy consider that while he walked 30 last year, he allowed only 28 hits. If he can pitch in the zone more regularly, whatever worries developed over 2016 should disappear quickly.
The bullpen’s rate of inherited runners scored
There are legitimate concerns about who will emerge as John Farrell’s eighth-inning bridge to Kimbrel, but an accompanying worry is whether the Sox have relievers the manager can turn to when he needs to escape a sticky situation. Some combination of Joe Kelly, Matt Barnes, Heath Hembree, and Robbie Ross Jr. are likely to get those calls early, and they’ll need to be better than last year, when the Sox’ bullpen allowed 33 percent of inherited runners to score, third-worst among AL teams in that category. The major-league average was 30 percent in 2016, with baseball’s five other division winners all at that rate or better.
Combined innings from Rodriguez, Wright, and Pomeranz
Kyle Kendrick had a nice spring, but there’s a reason he spent all of last season in the minor leagues after being released by the last-place Braves. If the Sox need to rely heavily on him, or turn to Henry Owens et al. with any frequency, they’re in trouble. However, if the combination of Eduardo Rodriguez, Steven Wright and Drew Pomeranz are effective and durable enough to total 425 innings between them, Boston should be in good shape. That’s roughly the equivalent of two and a half back-end, reliable starters; factoring in the time they’ll need to cover for David Price, that’d be a solid contribution from starter Nos. 4-6.
Price’s post-All-Star break innings
Since becoming a full-time big leaguer in 2009, Price has averaged 97.5 innings and made no fewer than 14 starts after the All-Star break. As the lefty deals with elbow soreness, the Sox should be exceedingly patient in their approach to getting him back on the mound, and prioritize having a healthy Price for the stretch run. If he is able to throw 90-plus innings after the midsummer break, it should indicate that the Sox had the David Price they expected — one of baseball’s premier starters — at full strength, more or less, for the second half.
Jackie Bradley’s OPS vs. right-handed pitching
His .902 OPS ranked him as one of baseball’s most productive left-handed hitters against right-handed pitching in 2016, and his improvement in those situations accounted for most of the offense upgrade that made it a breakout campaign. If he dips significantly this season, not only will it impact his own numbers, it could also take a toll on a righty-heavy lineup that figures to count on him for balance, especially at the bottom of the order.
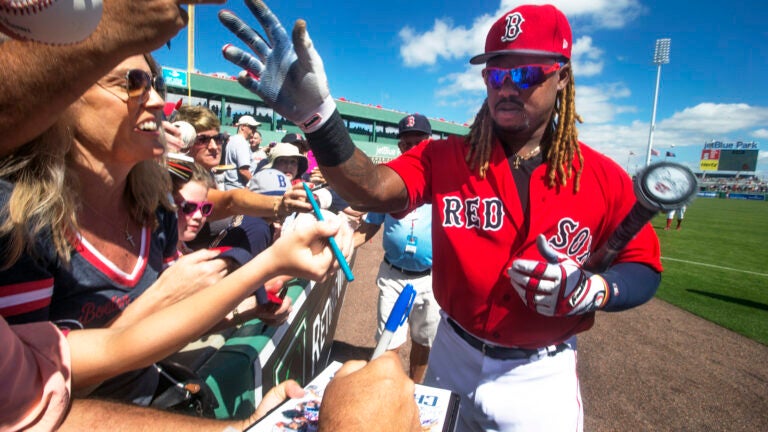
Hanley Ramirez’s power numbers
Last year was a nice bounce back for Ramirez, who had been written off by some after a rough first year in his return to Boston. He responded with 30 homers and 111 RBI. Given what David Ortiz was doing simultaneously, and Mookie Betts’ charge at an MVP award, that power seemed almost like a pleasant surprise at times. This year, though, it’s a necessity. Because of shoulder soreness Ramirez starts the year as a full-time DH, and with that role comes the burden of being this club’s premier slugger. The worry there is that the bad habits developed when he was homer happy in 2015 begin to hamper his swing again.
Games played by the core
A significant factor in Boston leading the American League in runs last season was the collective health of its hitters. Seven Red Sox appeared in at least 145 games. Betts and Xander Bogaerts ranked Nos. 2 and 3 in the AL in plate appearances. When players of that caliber are in the lineup every day, good things are going to happen. However, if a couple of those quality players are forced to the disabled list at some point, it remains to be seen what the offensive production will look like in this post-Papi era.
Ability to win low-scoring games
In the Division Series, the Sox failed to score five runs in any of the three games — and that was essentially a death sentence for the 2016 team. While Boston was 77-15 when plating at least five runs, including the playoffs the Sox were 16-57 when tallying four times or fewer. Repeating that tendency would be a tall ask of a lineup that just had a Hall of Famer ripped from its cleanup spot.
Boston’s April record
Since the introduction of division play in 1969, the 1975 club is the only of Boston’s 15 eventual playoff teams to reach May with a losing record. (Last year the Sox finished the month 14-10.) In each of its past three World Series-winning campaigns, the Sox had won two of every three games by the end of April. And across the majors over the past six years, 46 of 58 playoff teams finished April with at least as many wins as losses. It’s a marathon, not a sprint. But these early games can be telling.
Fenway performance
Last year was an exception, as the Sox went 47-34 (.580) at America’s self-bestowed Most Beloved Ballpark, but before then the club had since 1988 missed the playoffs in every season when failed to win 60 percent of its games at Fenway Park. Conversely, it had made the playoffs every campaign during that span in which its home winning percentage topped .600 (or the equivalent of at least 49 wins).