The endless variety of Boston’s neighborhoods
The Boston Redevelopment Authority just published a report looking at Boston by the numbers.
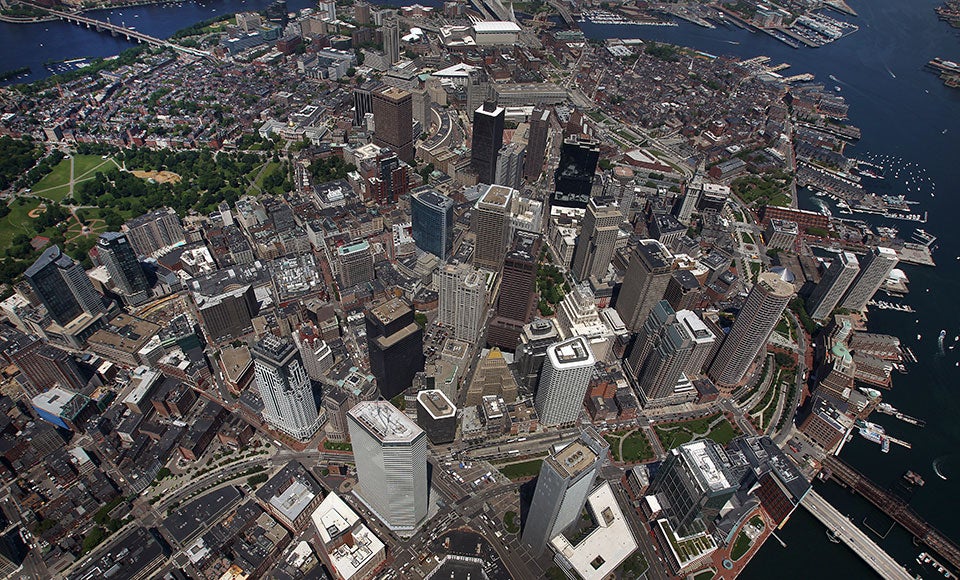
We all know how much Boston can differ neighborhood by neighborhood – the type of food, the amount of green space, and the activities to participate in.
But the Boston Redevelopment Authority (BRA) just came out with a “by the numbers’’ report, looking at aspects of residents like gender, national background, and age in 2014, and it shows that neighborhood differences extend beyond restaurants and architectural styles.
Here’s a breakdown of some of the biggest differences.
Immigrants
According to the BRA, the immigrant population in Boston grew from 151,836 to 177,461 across the years 2000 to 2014. Of the 25 largest United States cities, Boston ranked No. 7 for share of foreign-born residents. But immigrants are not spread out equally throughout Boston’s neighborhoods.
The Boston neighborhood with the highest foreign-born population in 2014 was East Boston, at 50.5 percent of its residents.
The next highest percentage was Mattapan, at 35.9 percent. Most of Boston’s neighborhoods fell around 20 percent of their residents being foreign born, but some were well below average, like the North End and Beacon Hill, both of which had populations that were about 10 percent foreign born.
Students
This may be more obvious, as students who don’t want to live in a dorm still want (and need) to live close to their campuses. Though Allston is often thought of as a student hub, it turns out that the Fenway/Kenmore area had almost triple the number of undergraduate students who chose to live off campus in fall 2014, with 3,280, than Allston, which had 1,250. Fenway had a total of 11,616 occupied housing units in the neighborhood and Allston had 6,609.
Other student-heavy neighborhoods included Brighton, Mission Hill, and Longwood/Fenway.
Owners versus renters
Of the 253,749 occupied housing units in Boston in 2014, 34.9 percent of them where owner-occupied. The BRA notes that this was a historically high number for the Hub.
In West Roxbury, Hyde Park, the South Boston Waterfront, and Roslindale over half of all occupied housing units were owner-occupied. On the other hand, neighborhoods like Mission Hill, Fenway, and Allston were all around 10 percent owner-occupied, well below the city’s average. (Remember how many students live in these places.)
Children
The BRA notes that a little under half of all households in Boston were family households in 2014, which the Census Bureau defines as “two or more people (one of whom is the householder) related by birth, marriage, or adoption residing in the same housing unit.’’
But some neighborhoods have virtually no children living in them. In Fenway, Longwood, the South Boston Waterfront, the North End, and Allston, children under 18 year old made up less than 5 percent of the population.
In the South Boston Waterfront in 2014, there were only 87 children in the neighborhood.
In Roxbury, Dorchester, Hyde Park, Mattapan, Roslindale, and East Boston over 20 percent of the neighborhood population was made up of children under 18.
Elderly
It seems that more and more elderly people are becoming empty nesters in the Hub, wanting to live close to things in the city. So it’s not surprising that the downtown area, Back Bay, and the West End are among the neighborhoods with the highest percentage of those over 65 years old. (But West Roxbury is still in the lead, with 17.8 percent of the population over 65.)
Again, Longwood, Allston, and Fenway all have the lowest percentage.
Related: These photos show that the North End was always awesome


To comment, please create a screen name in your profile
To comment, please verify your email address
Conversation
This discussion has ended. Please join elsewhere on Boston.com