Moving one MBTA stop away could save you hundreds in rent, study says
Boston rental prices increased an average of 3 percent this past year, with 90 MBTA stops seeing a price jump.
In a city as compact as Boston, it doesn’t take much of a move to find an apartment in an entirely different price range. Sometimes it can be just one MBTA stop away.
Boston rental prices increased an average of 3 percent this past year, according to the real estate website RentHop, with 90 MBTA stops seeing a price increase around their stations. This is fewer than in 2017, when 101 saw an uptick. Still, more than half of the Boston stops experienced growth, and Kendall/MIT was the only Cambridge station to avoid a price increase. In all, 21 MBTA stops saw a decrease in price growth, and 10 underwent no change.
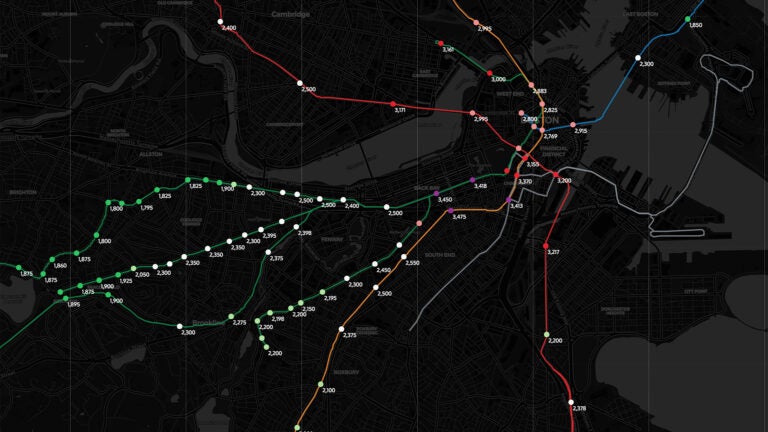
RentHop created a map to illustrate both median rent prices around MBTA stops and year-to-year changes in those areas. The data revealed that moving just one MBTA stop away can make a big difference in rental price. Case in point: Moving from the Broadway stop ($3,217) to Andrew Station ($2,200) on the Red Line could save residents $1,017 a month.
Similarly, one could save $950 by moving from Copley ($3,450) to Hynes Convention Center ($2,500) on the Green Line, $925 from Back Bay ($3,475) to Massachusetts Avenue ($2,550) on the Orange Line, $671 from Kendall/MIT ($3,171) to Central ($2,500) on the Red Line, and $615 from Aquarium ($2,915) to Maverick ($2,300) on the Blue Line.
RentHop came to these numbers by calculating the median of 50 unique data points within 0.62 of a mile of each MBTA stop. If there weren’t enough data points in that radius, the distance was increased to 1.2 miles, and the data were resampled. RentHop data for one-bedroom apartments from February through April 2017 and 2018, as well as MBTA data for T stops from the Massachusetts Bureau of Geographic Information (MassGIS), were utilized to get the median rents.
The price disparities could be products of stop locations on the edge of a neighborhood, rents near one stop dropping while rents near the other soar, or the different types of apartments available around T stops, according to the study.
The greatest increases in rental prices were found at the Airport stop on the Blue Line ($1,850, 8.8 percent), Fenwood Road on the Green Line ($2,200, 8.6 percent), Green Street on the Orange Line ($2,150, 8.2 percent), Broadway on the Red Line ($3,217, 7.2 percent), and Waban on the Green Line ($2,250, 7.1 percent).
The largest price drops were found at Savin Hill on the Red Line ($2,364, 6.4 percent), Back Bay on the Orange Line ($3,475, 6.1 percent), Woodland on the Green Line ($1,800, 5.9 percent), Mattapan on the Red Line ($1,650, 5.7 percent), and Boylston on the Green Line ($3,135, 4.9 percent).
Subscribe to our free real estate newsletter at pages.email.bostonglobe.com/AddressSignUp.


To comment, please create a screen name in your profile
To comment, please verify your email address
Conversation
This discussion has ended. Please join elsewhere on Boston.com