


Address Newsletter
Our weekly digest on buying, selling, and design, with expert advice and insider neighborhood knowledge.
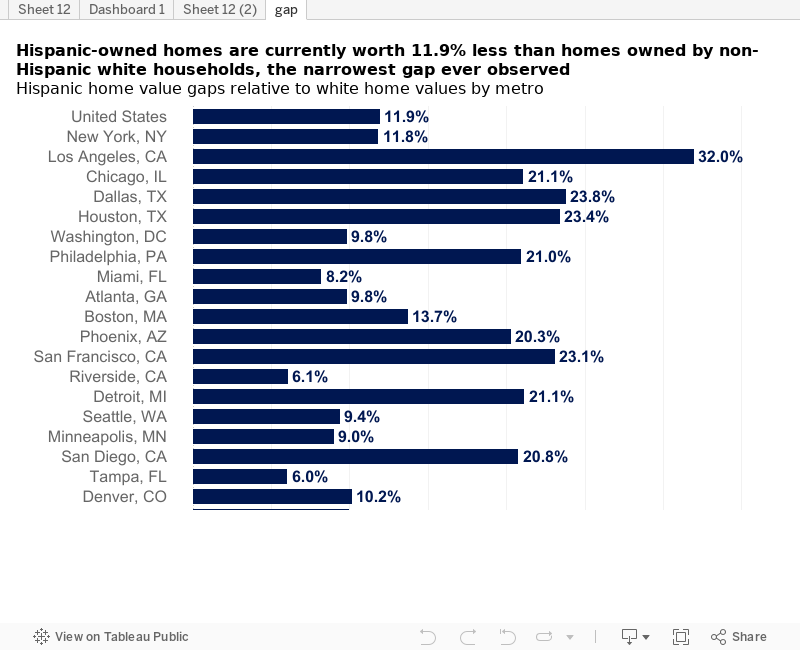
The value gap between Hispanic- and white-owned homes in metro Boston has narrowed, according to a report Zillow released on Oct. 14.
Hispanic-owned homes here were valued at 13.7 percent less than white-owned properties in 2024, down 0.6 percentage points compared to a year ago and 1.8 percentage points from five years ago.
In Providence, the home value gap was 10.6 percent, and in Hartford, the number was markedly higher, 15.1 percent. In Providence, the gap shrunk 0.6 percentage points from a year ago and 3.2 percentage points compared to five years ago. For Hartford, the gap was 0.2 percentage points lower than a year ago and a 2.7 percentage point decrease from five years ago, according to Zillow.
This follows a national trend.
“Hispanic-owned homes are currently worth 11.9 percent less than homes owned by non-Hispanic white households, down from 12.1 percent last year and a recent high of 12.4 percent in December 2021,” Zillow reported. ” The gap was as wide as 18 percent in 2012, following the global financial crisis of 2007–2009, when many minority communities were hit especially hard, setting back progress by several years. The slow climb back continued steadily until interrupted in 2021, but the course has now been corrected.”
Rising home prices and a lack of affordable housing have played contributing roles, according to the report.
“The narrowing of the gap can be attributed to affordability challenges in the market, which have significantly boosted demand in more affordable areas where many Hispanic homeowners reside,” said Treh Manhertz, senior economic research scientist at Zillow.
Manhertz added that this has led to faster home appreciation, supported by stable or even improving credit conditions for many people.
“Economic factors, discrimination in lending practices, and challenges in acquiring and maintaining homeownership could further widen this gap,” he said.
For Manhertz, the factors that contribute to racial disparity in home values across nations include “systemic barriers and historical inequalities in access to resources such as down payment assistance, credit-building programs, and affordable housing options.”
He added that the disparities in wealth accumulation and homeownership rates over time have also contributed to the existing gap.
Here’s how cities across the nation fared:
| Region | Typical Home Value | Year-Over-Year Change | Home Value Gap | One-Year Change in Home Value Gap | Five-Year Change in Home Value Gap |
|---|---|---|---|---|---|
| United States | $328,283 | 2.60% | -11.90% | 0.14 | 0.83 |
| New York | $616,961 | 7.00% | -11.80% | 0 | 3.12 |
| Los Angeles | $757,081 | 6.20% | -32.00% | 0.75 | 1.26 |
| Chicago | $277,784 | 5.80% | -21.10% | 0.73 | 2.97 |
| Dallas | $308,407 | -0.50% | -23.80% | -0.21 | 0.48 |
| Houston | $262,205 | 0.20% | -23.40% | -0.37 | 0.93 |
| Washington, D.C. | $530,240 | 3.20% | -9.80% | -0.05 | -0.26 |
| Philadelphia | $306,432 | 5.60% | -21.00% | 0.73 | 2.9 |
| Miami | $481,455 | 4.50% | -8.20% | 1.11 | 0.73 |
| Atlanta | $367,869 | 2.10% | -9.80% | -0.17 | 1.4 |
| Boston | $612,730 | 6.20% | -13.70% | 0.55 | 1.79 |
| Phoenix | $382,548 | 1.30% | -20.30% | 0.16 | 1.47 |
| San Francisco | $933,036 | 2.40% | -23.10% | 0.25 | -0.57 |
| Riverside, Calif. | $555,505 | 5.00% | -6.10% | 1.07 | 0.78 |
| Detroit | $214,780 | 4.10% | -21.10% | 0.16 | 1.59 |
| Seattle | $672,295 | 3.80% | -9.40% | -0.25 | 0.21 |
| Minneapolis | $345,525 | -0.10% | -9.00% | -0.13 | -0.75 |
| San Diego | $789,845 | 6.00% | -20.80% | -0.01 | -1.37 |
| Tampa | $361,364 | 0.70% | -6.00% | 0.47 | 1.24 |
| Denver | $534,266 | 0.30% | -10.20% | -0.06 | 0.39 |
| Baltimore | $361,431 | 2.20% | -10.00% | -0.04 | 0.6 |
| St. Louis | $237,436 | 3.20% | -10.00% | 0.26 | 0.07 |
| Orlando | $382,635 | 1.60% | -6.50% | 0.28 | 0.84 |
| Charlotte, N.C. | $354,059 | 2.30% | -10.60% | -0.38 | 1.16 |
| San Antonio | $253,056 | -3.30% | -20.00% | -0.58 | -2.22 |
| Portland, Ore. | $522,869 | 0.40% | -4.80% | 0.05 | 0.36 |
| Sacramento | $545,042 | 1.90% | -6.70% | 0.07 | 1.07 |
| Pittsburgh | $212,743 | 2.90% | -1.80% | 0.3 | 0.52 |
| Cincinnati | $288,459 | 3.90% | -0.40% | 0.18 | 0.76 |
| Austin, Texas | $386,620 | -4.70% | -20.00% | -0.12 | -0.2 |
| Las Vegas | $394,817 | 6.30% | -11.80% | 0.15 | 1.22 |
| Kansas City, Mo. | $259,774 | 3.10% | -16.90% | 0.56 | 4.92 |
| Columbus, Ohio | $301,314 | 3.80% | -6.10% | 0.29 | 1.79 |
| Indianapolis | $257,310 | 2.80% | -9.30% | 0.33 | 2.87 |
| Cleveland | $197,351 | 6.30% | -19.70% | 0.6 | 1.82 |
| San Jose, Calif. | $1,205,284 | 8.30% | -29.50% | -0.19 | — |
| Nashville | $410,933 | 1.20% | -8.40% | -0.08 | -0.34 |
| Virginia Beach, Va. | $340,167 | 4.10% | -5.60% | -0.02 | 0.41 |
| Providence | $443,424 | 7.70% | -10.60% | 0.61 | 3.17 |
| Jacksonville, Fla. | $351,709 | 0.00% | -5.30% | -0.16 | -0.2 |
| Milwaukee | $302,557 | 6.40% | -16.50% | 1.33 | 3.78 |
| Oklahoma City | $188,978 | 2.90% | -22.40% | 0.92 | 2.31 |
| Raleigh, N.C. | $399,795 | 0.80% | -12.10% | -0.55 | 0.2 |
| Memphis | $206,021 | 0.10% | -24.50% | 0.18 | 2.2 |
| Richmond | $354,300 | 3.60% | -8.10% | -0.95 | 1.93 |
| Louisville, Ky. | $239,268 | 3.60% | -10.20% | 0.62 | 1.26 |
| New Orleans | $227,884 | -4.90% | -10.50% | -0.09 | -0.38 |
| Salt Lake City | $474,847 | 1.40% | -14.30% | 0.38 | 1.57 |
| Hartford | $320,684 | 8.20% | -15.10% | 0.22 | 2.69 |
| Buffalo | $234,885 | 5.90% | -15.50% | 0.28 | 0.43 |
| Birmingham, Ala. | $214,607 | -1.10% | -23.60% | -0.21 | 0.86 |
| Rochester, N.Y. | $212,113 | 8.50% | -20.50% | 1.19 | 0.88 |
| Grand Rapids, Mich. | $296,116 | 4.30% | -10.10% | 0.07 | 1.77 |
| Tucson | $306,415 | 2.40% | -17.30% | 0.29 | 1.48 |
| Urban Honolulu, Hawaii | $837,579 | 0.20% | -9.40% | 0.11 | 1.6 |
| Tulsa, Okla. | $203,248 | 5.10% | -16.60% | 0.91 | 4.17 |
| Fresno, Calif. | $361,363 | 3.70% | -14.80% | 0.44 | 1.77 |
| Worcester, Mass. | $417,878 | 6.70% | -9.30% | 0.2 | 1.97 |
| Omaha | $235,734 | 2.50% | -20.60% | 0.34 | 2.91 |
| Bridgeport, Conn. | $476,062 | 7.10% | -28.90% | 0.29 | 1.01 |
| Greenville, S.C. | $282,466 | 2.60% | -5.10% | 0.08 | 0.5 |
| Albuquerque | $317,233 | 3.80% | -10.40% | 0.37 | 2.49 |
| Bakersfield, Calif. | $341,373 | 5.40% | -6.70% | 0.88 | 3.11 |
| Albany, N.Y. | $326,272 | 6.00% | -3.70% | 0.09 | 0.31 |
| Knoxville, Tenn. | $334,875 | 4.80% | -3.60% | 0.13 | 0.4 |
| Baton Rouge, La. | $237,438 | 1.10% | -4.50% | -0.03 | -0.56 |
| McAllen, Texas | $185,676 | 4.10% | -2.50% | 0.49 | 1.74 |
| New Haven | $312,071 | 8.80% | -20.40% | 1.07 | 4.72 |
| El Paso | $214,898 | 3.40% | -11.00% | -0.06 | -0.12 |
| Allentown, Pa. | $298,125 | 6.10% | -12.60% | 0.51 | 3.49 |
| Oxnard, Calif. | $781,421 | 5.20% | -13.90% | 0.64 | 0.78 |
| Columbia, S.C. | $241,786 | 3.20% | -6.60% | 0.03 | 0.12 |
| North Port, Fla. | $386,768 | -3.80% | -14.10% | 0.23 | 0.76 |
| Dayton, Ohio | — | — | — | — | — |
| Charleston, S.C. | $429,839 | 4.00% | -6.00% | -0.14 | -0.09 |
| Greensboro, N.C. | $238,007 | 3.90% | -11.10% | 0.48 | 0.82 |
| Stockton, Calif. | $493,040 | 2.30% | -9.70% | 0.18 | 1.43 |
| Cape Coral, Fla. | $343,382 | -3.30% | -13.20% | 1.59 | 4.27 |
| Boise City, Idaho | $464,466 | 2.80% | -2.80% | 0.07 | 0.25 |
| Colorado Springs | $409,478 | 0.00% | -12.50% | -0.32 | 0.32 |
| Little Rock, Ark. | $185,896 | 4.10% | -20.10% | 0.61 | -0.95 |
| Lakeland, Fla. | $315,409 | -0.80% | 0.20% | -0.45 | -0.86 |
| Akron, Ohio | $197,938 | 6.90% | -12.20% | 1.23 | 2.93 |
| Des Moines, Iowa | $234,000 | 3.80% | -18.20% | 0.92 | 2.3 |
| Springfield, Mass. | $321,597 | 6.50% | -11.50% | 0.75 | 4.91 |
| Poughkeepsie, N.Y. | — | — | — | — | — |
| Ogden, Utah | $469,761 | 1.30% | -5.60% | 0.03 | 0.28 |
| Madison, Wis. | $404,765 | 5.40% | -2.20% | 0.15 | 1.05 |
| Winston, N.C. | $251,975 | 4.70% | -8.40% | 0.43 | 1.6 |
| Deltona, Fla. | $328,665 | 0.70% | -6.20% | 1.42 | 2.43 |
| Syracuse, N.Y. | $216,714 | 10.60% | -11.20% | 0.47 | 0.7 |
| Provo, Utah | $492,017 | 0.20% | -7.00% | -0.11 | 0.21 |
| Toledo, Ohio | $172,244 | 5.10% | -11.70% | 0.69 | 2.66 |
| Wichita, Kan. | $181,120 | 7.00% | -18.70% | 1.02 | 4.03 |
| Durham, N.C. | $392,000 | 1.90% | -6.10% | -0.15 | 0.19 |
| Augusta, Ga. | $229,761 | 2.10% | -2.60% | -0.41 | -4.6 |
| Palm Bay, Fla. | $344,506 | -1.00% | -4.30% | -0.03 | 0.35 |
| Jackson, Miss. | $208,466 | -0.60% | 0.20% | 0.02 | 0.65 |
| Harrisburg, Pa. | $252,998 | 4.30% | -12.10% | 0.87 | 3.18 |
| Spokane, Wash. | $390,956 | 0.40% | -5.70% | 0.02 | 0.43 |
Here’s a glimpse of where the Boston area stands in terms of the Hispanic-home value gap, relative to other metros:
According to the report, the national home value gap for Black homeowners narrowed as well, from 17.9 percent to 17.7 percent. “The gap remains wider compared to mid-2022 (17.2 percent) and mid-2007, shortly before the housing bust (16.3 percent).”
In metro Boston, the Asian-white homeownership gap stands at 3 percent, with the typical Asian home value standing at $731,431. For Black-white homeownership, the gap is 17.9 percent, with the typical Black home value at $583,172, according to Zillow.
Manhertz said efforts to improve access to resources like down payment assistance and credit-building programs are crucial to sustain this positive trend. “Policies aimed at reducing upfront costs and increasing access to credit can also help reduce these barriers and increase access to affordable and stable housing,” he said.
Our weekly digest on buying, selling, and design, with expert advice and insider neighborhood knowledge.


To comment, please create a screen name in your profile
To comment, please verify your email address
Conversation
This discussion has ended. Please join elsewhere on Boston.com